模板
各种地图类型名称
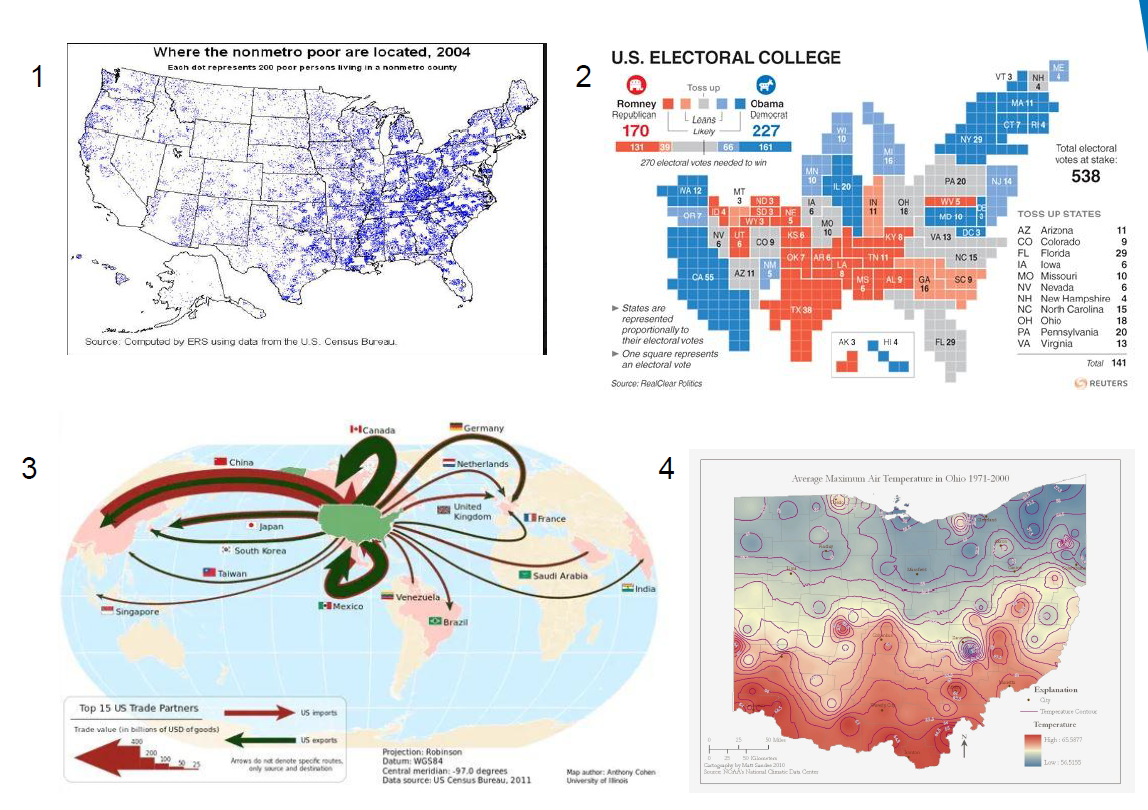
1. Dot Density map: Dot density mapping shows quantitative data associated with regions that have
fixed boundaries. Dots or some other symbol are drawn on the region in a semi-random
distribution. The number of dots is proportional to the data value.
2. Cartogram (discrete):the map is “exploded” so that there is sufficient room between the regions for them to grow in size.
In this kind of map the regions preserve their shape but how they fit together is more
difficult to see. In a more abstract variant, the regions are replaced by a simple
geometric shape such as a circle.
3. Flow map: Discrete flow maps show the movement of commodities such as goods or people between places. They are also
called origin-destination (OD) maps.
4. Isarithmic map: A useful metaphor for visualising quantitative data that varies continuously
across space is to map it to a kind of conceptual height or elevation for each point on
the map. The resulting 3D map is then visualised using standard techniques for showing
elevation like contours, wire-frames, surfaces or shaded relief.
5. Cartogram (contiguous): Cartograms are also called value-by-area maps. They are for mapping
quantitative data with a natural zero, such as population or average income, to regions.
6. Choropleth map + Proportional symbol map: Choropleth mappings show categorical and ranked
(both ordinal and quantitative) data associated with regions that have fixed boundaries.
These regions are typically political or administrative boundaries. The data value is
usually represented using colour though sometimes a pattern is used and regions on the
map are filled with the colour or pattern corresponding to their data value.
7. Proportional symbol map: In this kind of map, a symbol (such as a circle, triangle, square
or pictorial icon) is used to show ordered data associated with either a region or a
particular location. The size of the symbol is proportional to the data value.
8. Prism map: A prism map is a variant of a choropleth map in which height is used to show
the data value. Prism maps are well suited to comparing quantitative data.

Projection分类
• Equal area (or equivalent): projections preserve area.
• Conformal: projections preserve angles locally,
• Equidistant: projections preserve distance from a particular location (at most two)
• Azimuthal: projections preserve directions from a particular location
• Compromise: projections ensure that area and shape distortion is “not too bad”